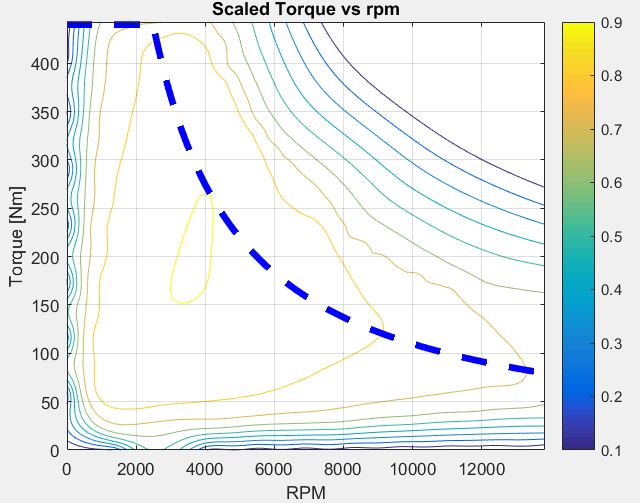
Torque vs RPM motor map with efficiency contours
- The base motor map is provided showing variation of motor torque (Nm) with motor speed (RPM)
- The dotted blue line indicates the cut off region for the torque curve
Data:
- mass=1846 kg
- Cd=0.24 (Drag co-efficient)
- Crr=0.0079 (rolling resistance co-efficient)
- frontal area=2.45 sq. m
- Transmission efficiency=0.98
- Power electronics efficiency=0.95
- wheel radius=0.36m
- Motor to wheel gear ratio=8
Built MATLAB scripts to simulate and plot several vehicle parameters based on three driving cycles viz:
- City driving cycle
- Highway driving cycle
- US06 driving cycle
Kindly contact for detailed explanation of MATLAB scripts and simulation results.
Note: Regenerative braking is taken into consideration in these simulations; we can see from the results (plots on MATLAB) the increase of SOC whenever braking happens
CITY DRIVING CYCLE:
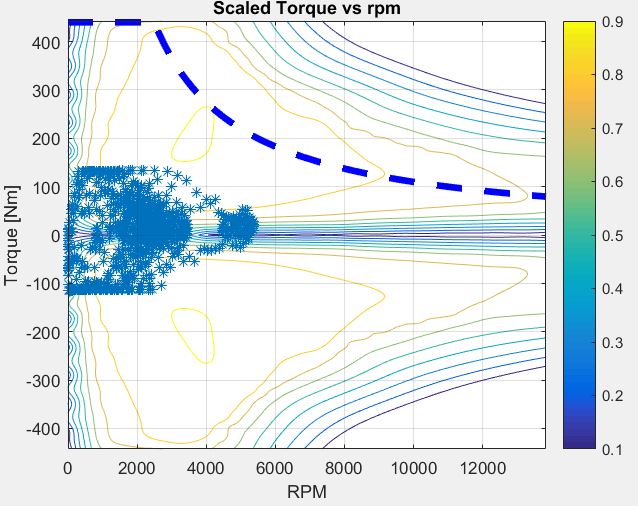
Operating motor points in city driving cycle
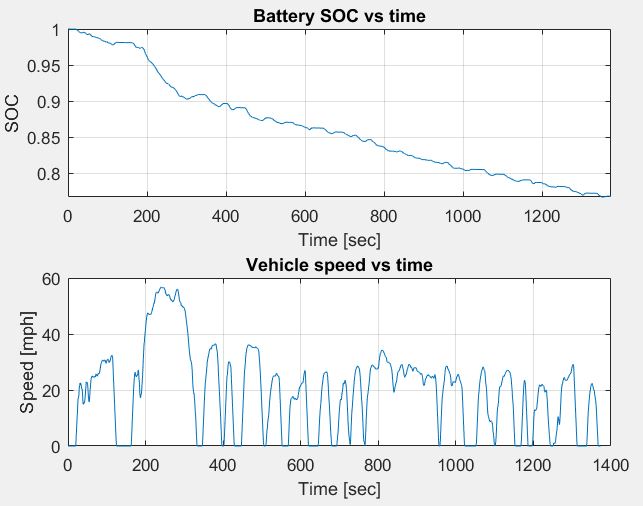
Variation of Battery SOC (State of charge) in city driving cycle
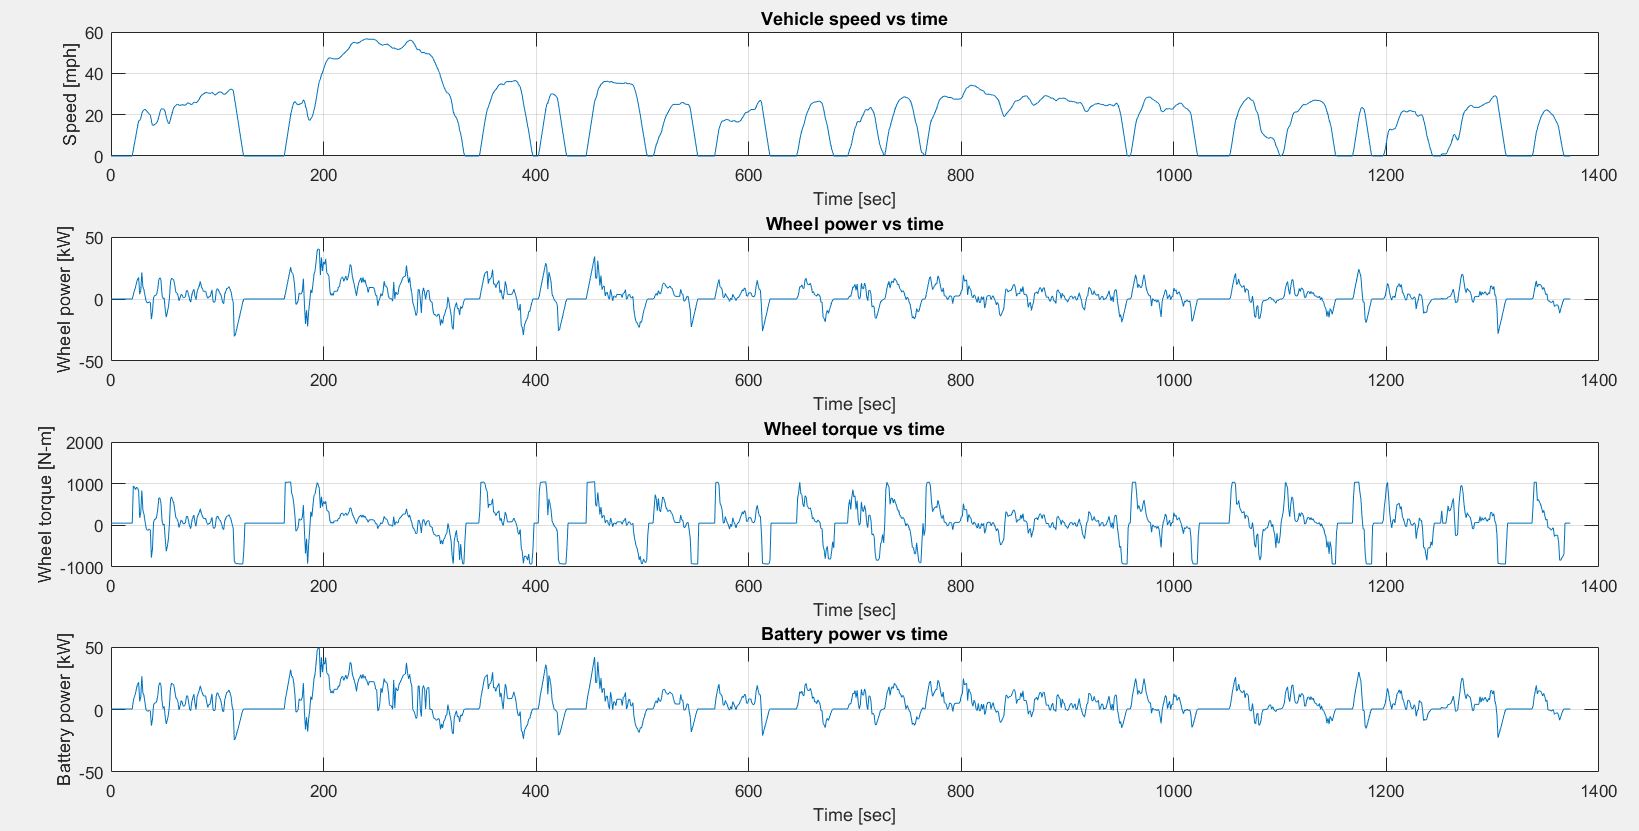
City driving cycle plots on MATLAB
HIGHWAY DRIVING CYCLE:
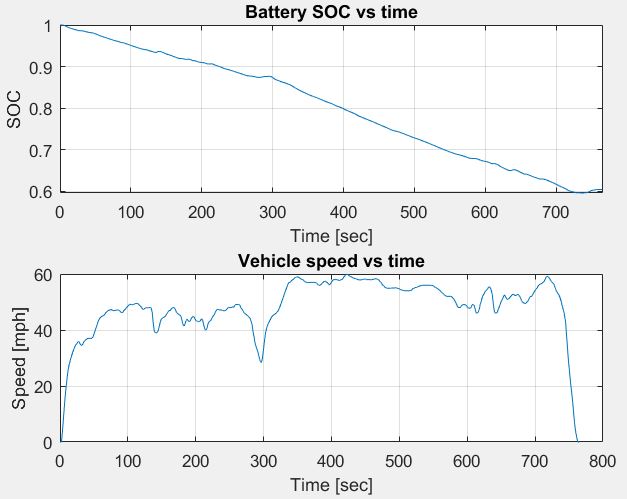
Variation of Battery SOC (State of charge) in hwy driving cycle
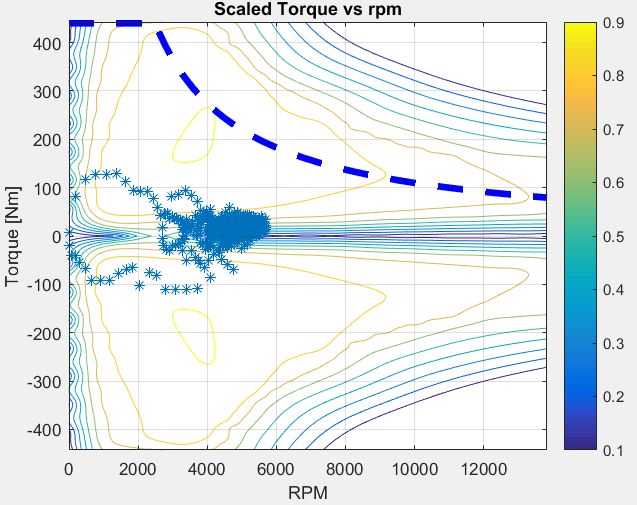
Operating motor points in highway driving cycle
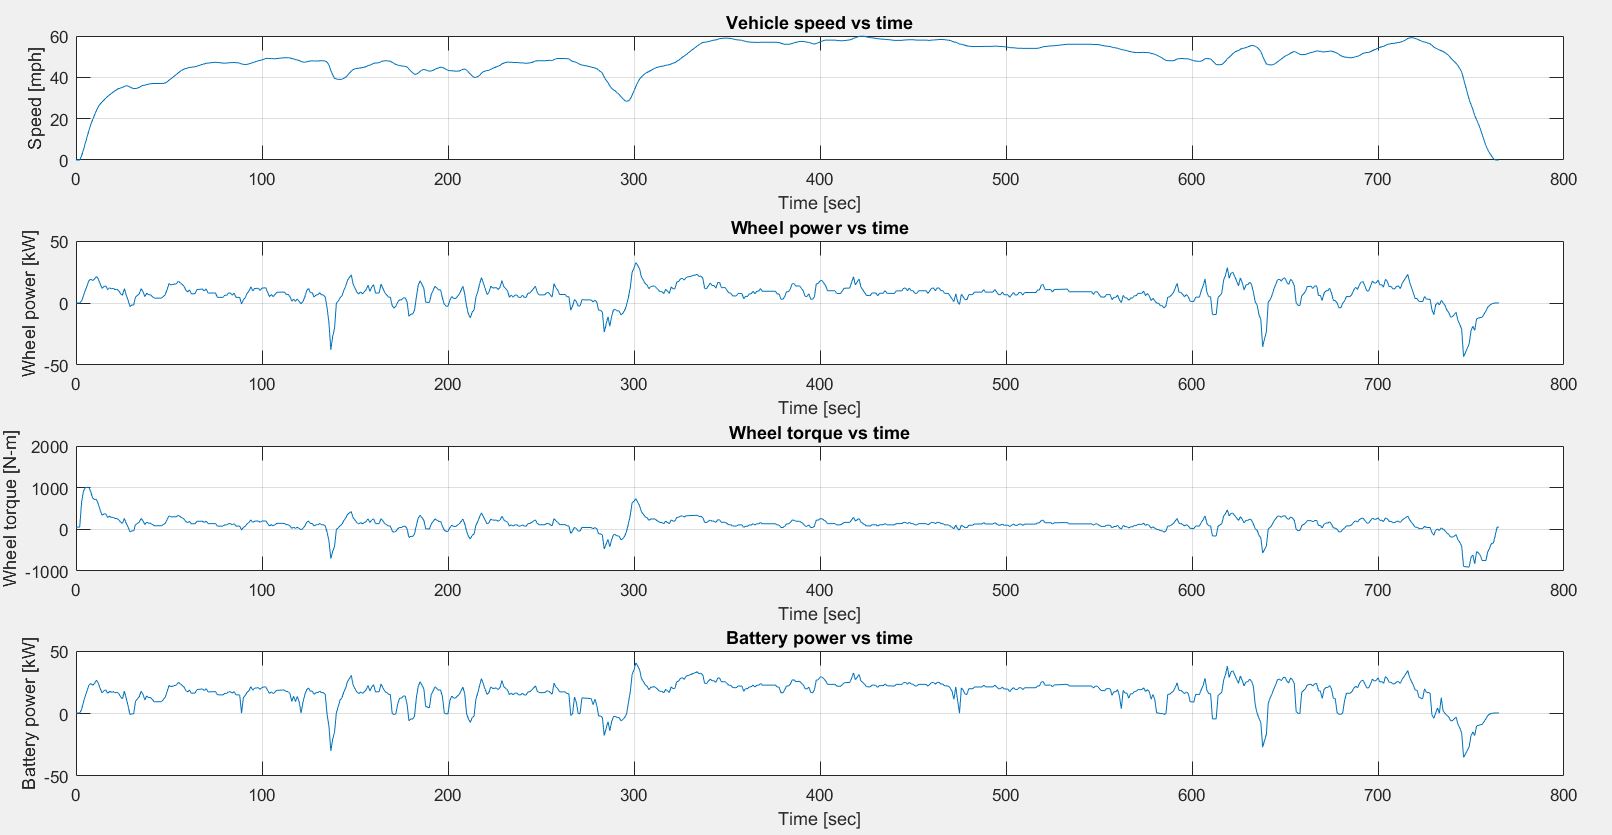
Highway driving cycle plots on MATLAB
US06 DRIVING CYCLE:
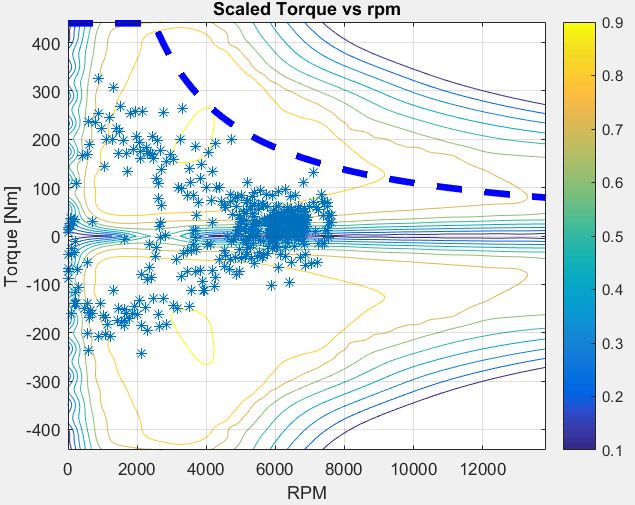
Operating motor points in us06 driving cycle
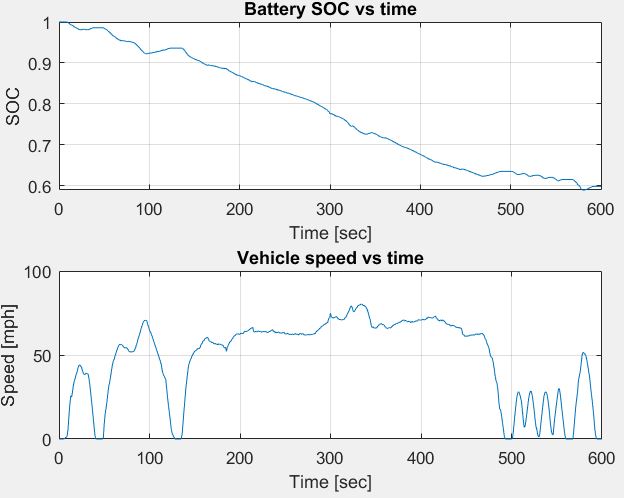
Variation of Battery SOC (State of charge) in us06 driving cycle
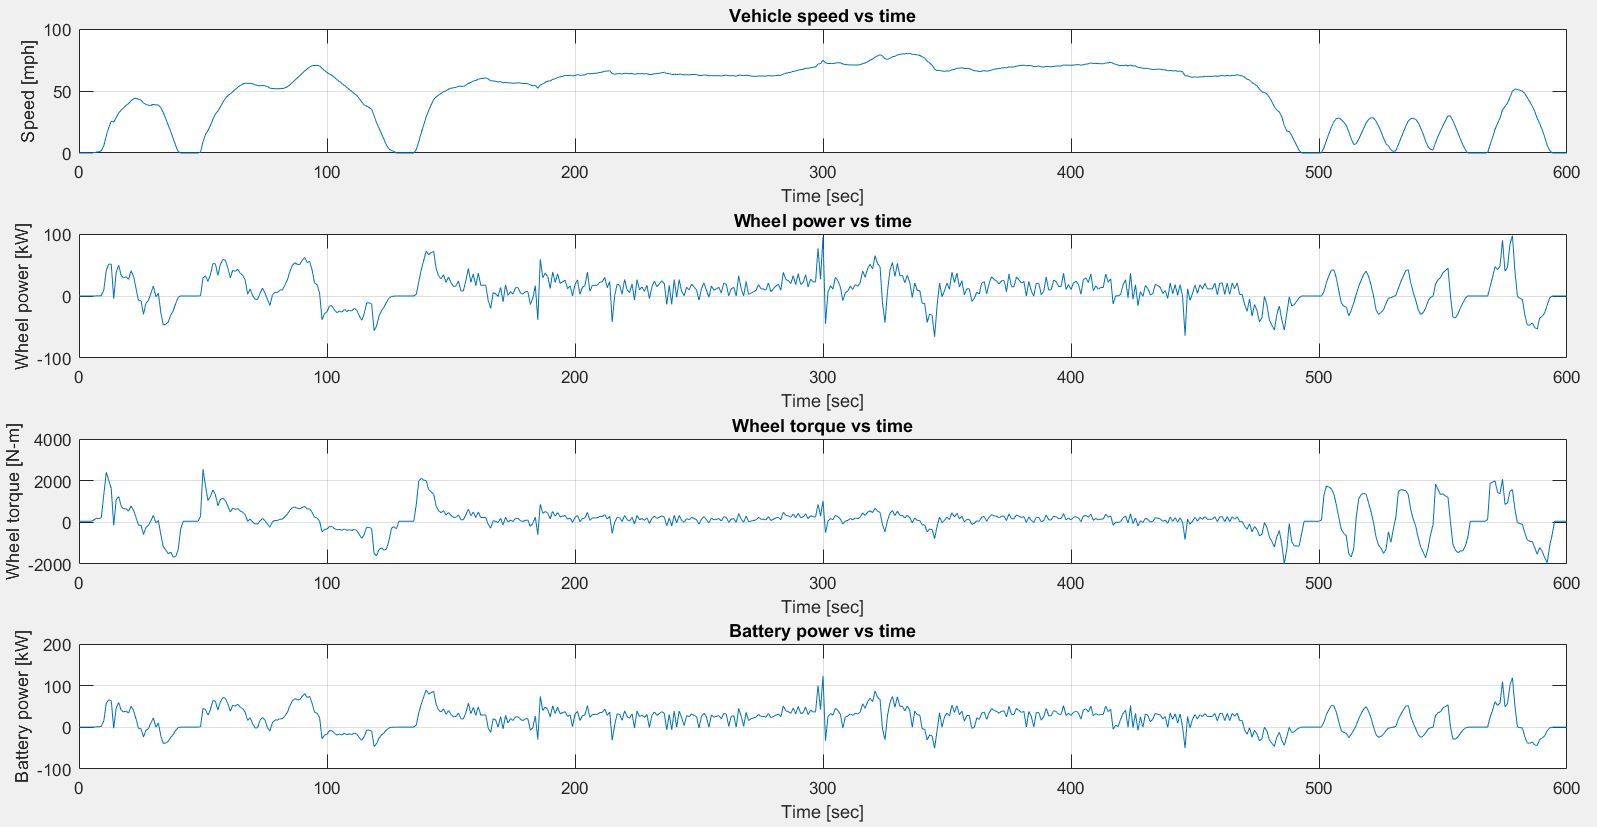
US06 driving cycle plots on MATLAB
HIGH Level SIMULINK MODEL:
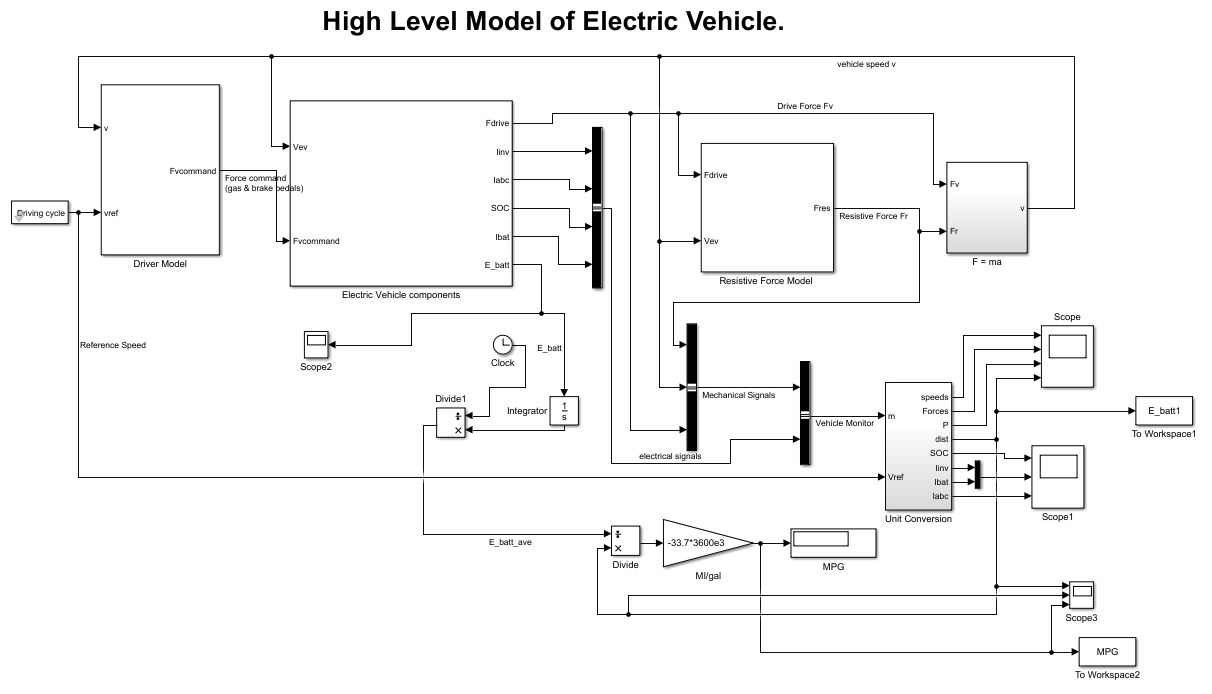
High level EV simulink model
- Several vehicle sub-systems modelled on Simulink as shown in the diagram above
- With the closed loop feedback to the driver model, continuous monitoring of vehicle parameters such as motor speed, torque, wheel speed, torque, battery SOC, a,b and c currents of the motor and so on.
- MPGe of the vehicle in different driving cycles was computed to analyse, control & improve performance and efficiency by performing various iterations of vehicle parameters depending on load conditions
Kindly contact for a detailed overview of the system and Simulink sub blocks within the system for better understanding and control.