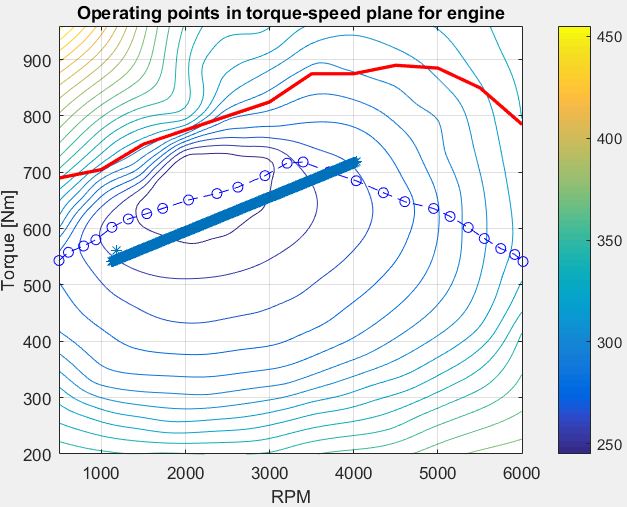
Engine Map
- The base engine map is provided showing variation of engine torque (Nm) with engine speed (RPM)
- The dotted blue line indicates the OOL (Optimum operating line) with least bsfc (g/kwh)
- The red line indicates the max torque line for the engine
Built MATLAB scripts to simulate and plot several vehicle parameters based on three driving cycles viz:
- City driving cycle
- Highway driving cycle
- US06 driving cycle
Note:
- Regenerative braking is taken into consideration, observe SOC peaks during deceleration
- Control strategy is implemented for sustaining SOC between 100 % and 85 %
- Engine is turned on and off accordingly whenever battery SOC reaches the predefined limit (Control strategy implemented in MATLAB script)
CITY DRIVING CYCLE:
Operating motor points in city driving cycle
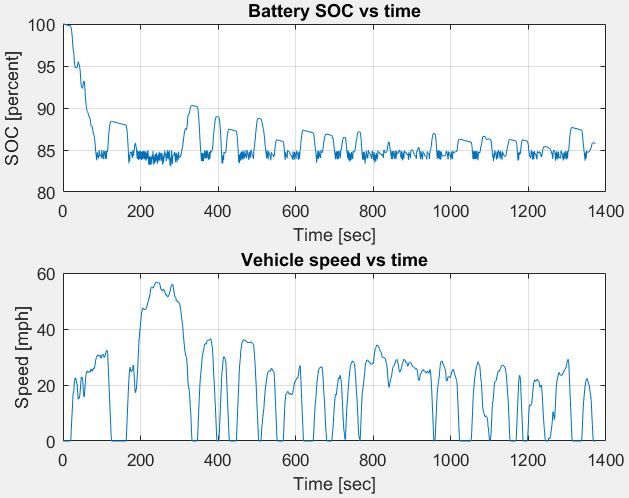
Sustaining SOC and variation of SOC in city driving cycle
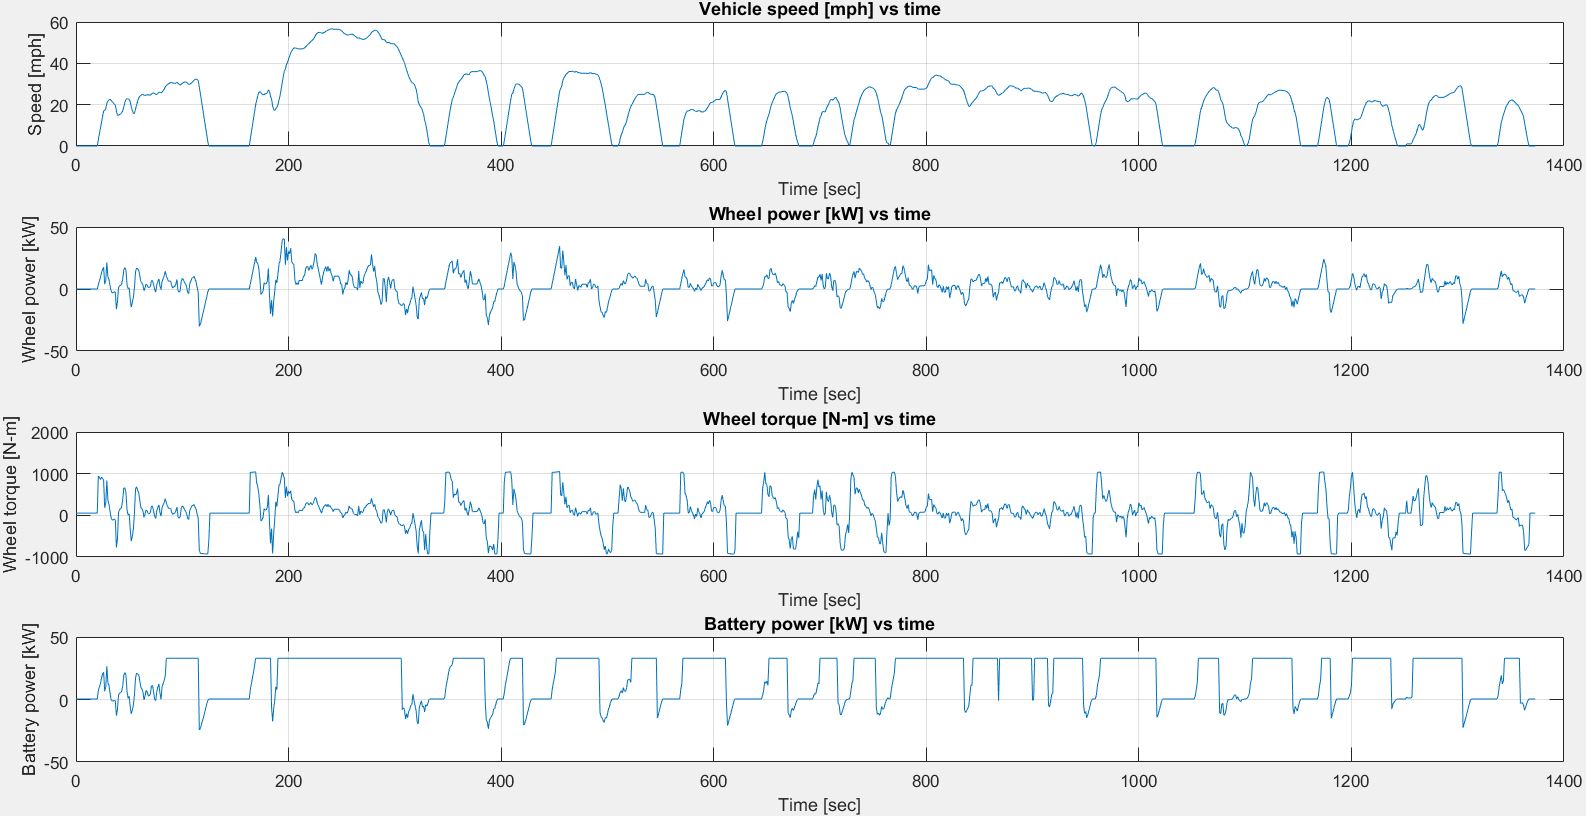
City driving cycle plots monitoring battery power
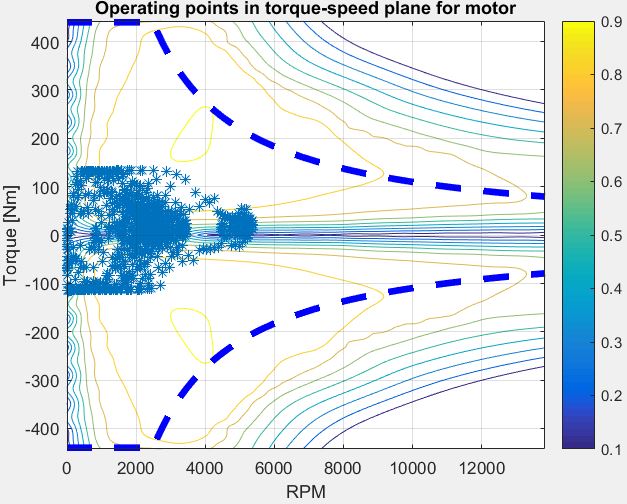
City driving cycle points monitoring Engine parameters
HIGHWAY DRIVING CYCLE:
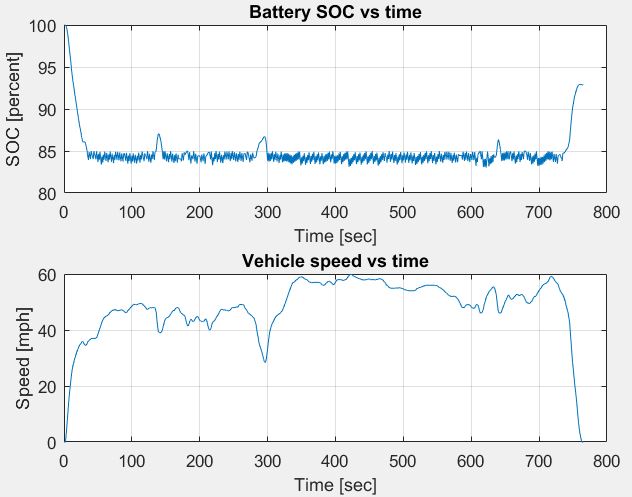
Sustaining SOC and variation of SOC in highway driving cycle
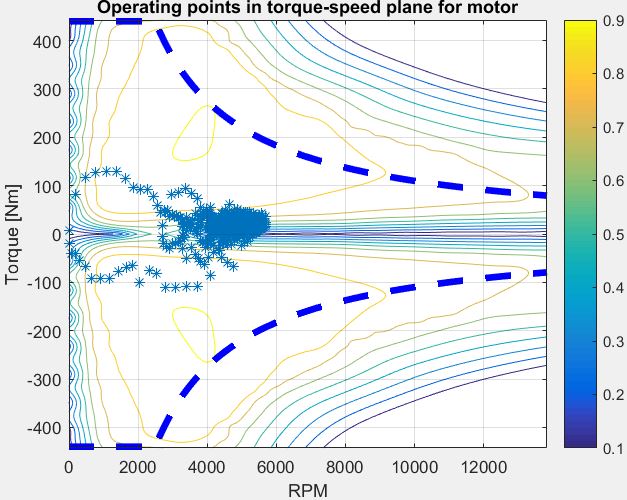
Operating motor points in highway driving cycle
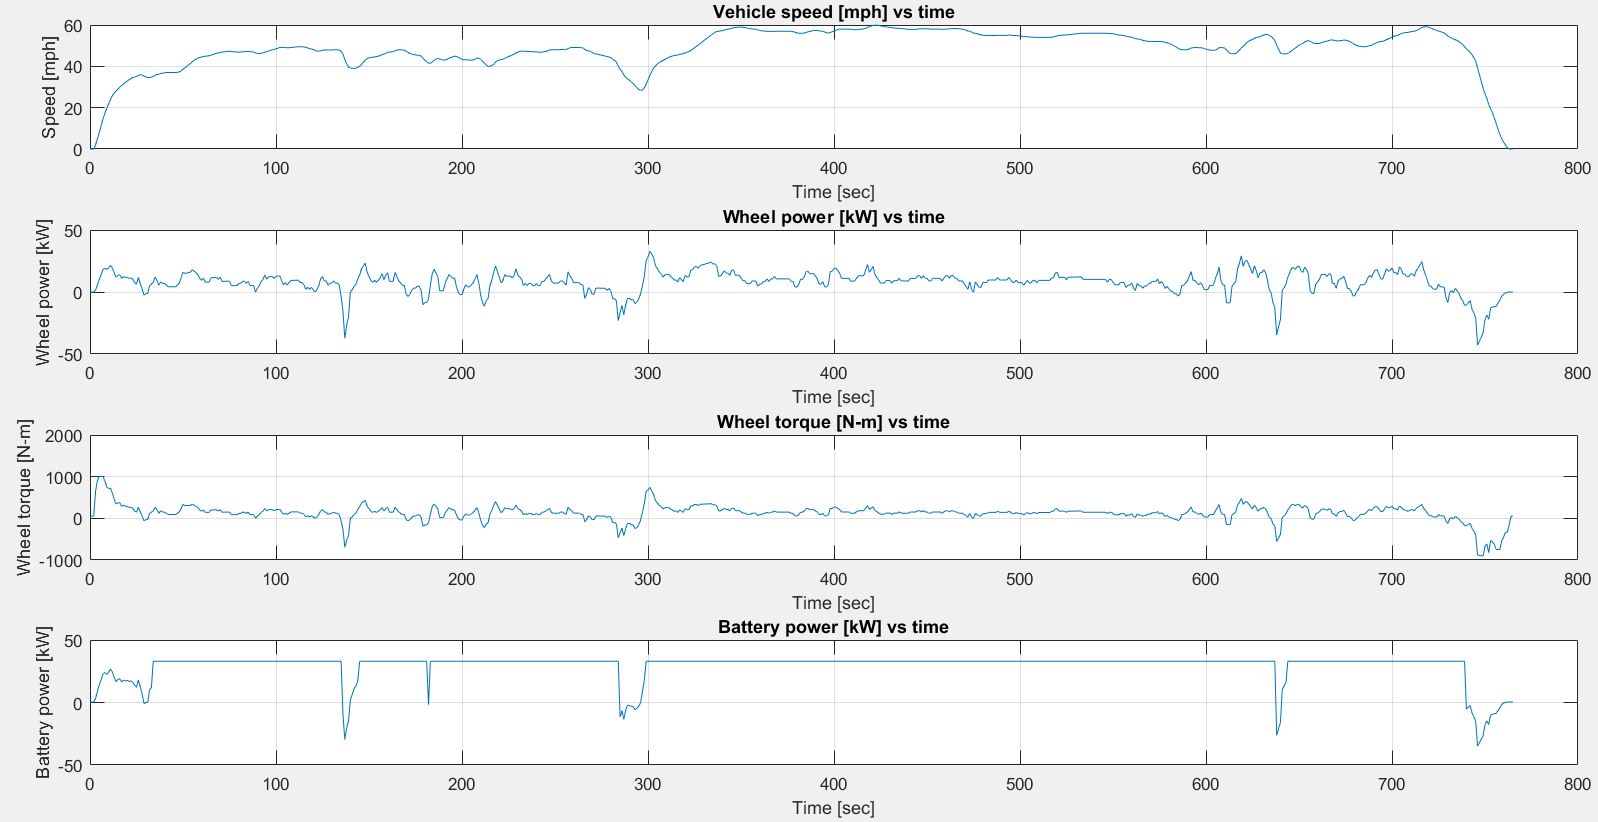
Highway driving cycle plots monitoring battery power
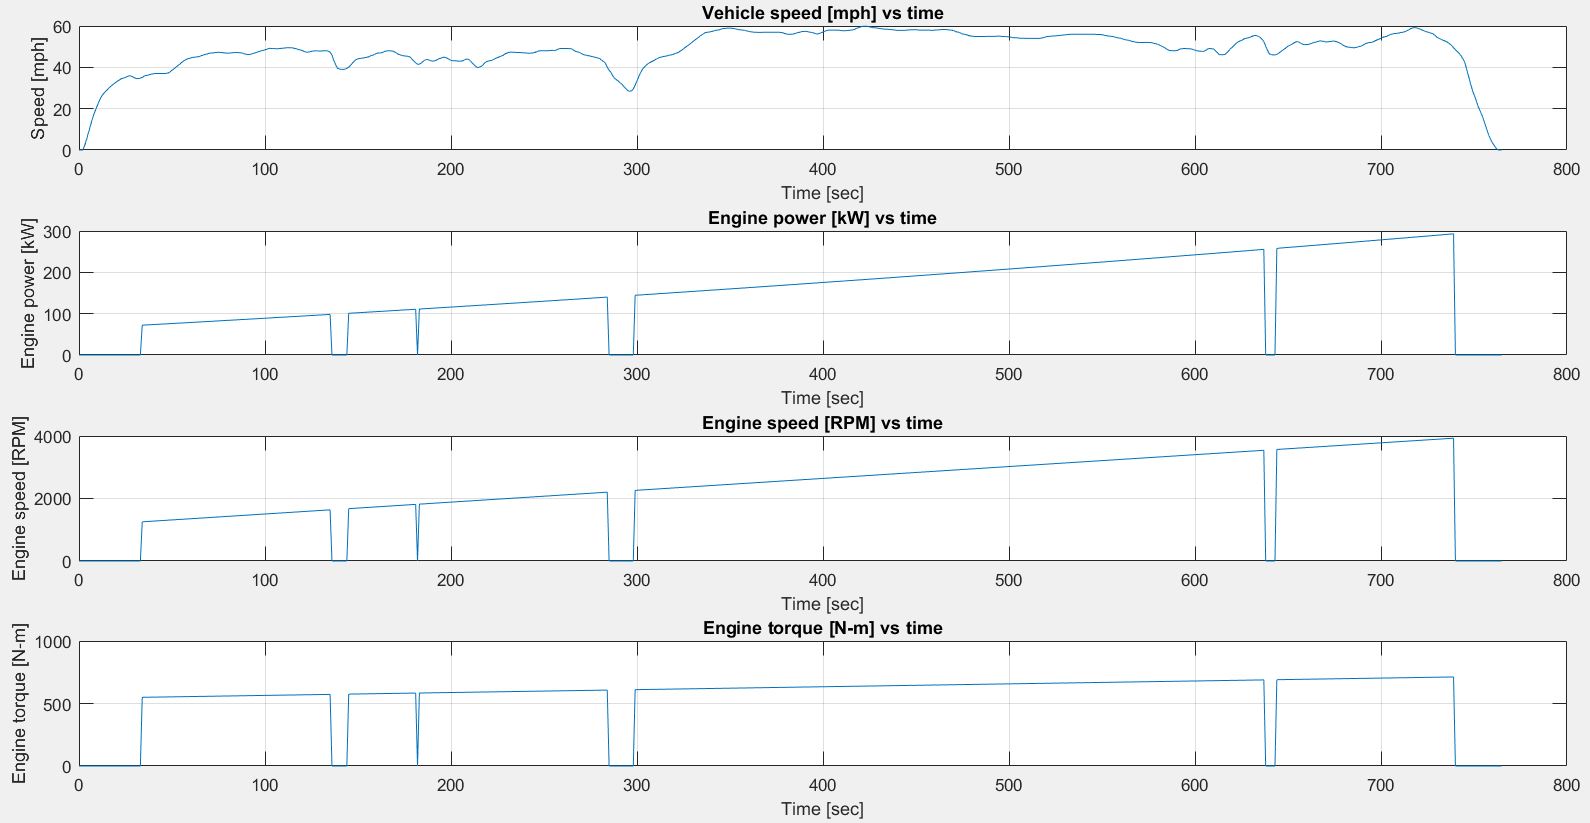
Highway driving cycle plots monitoring Engine parameters
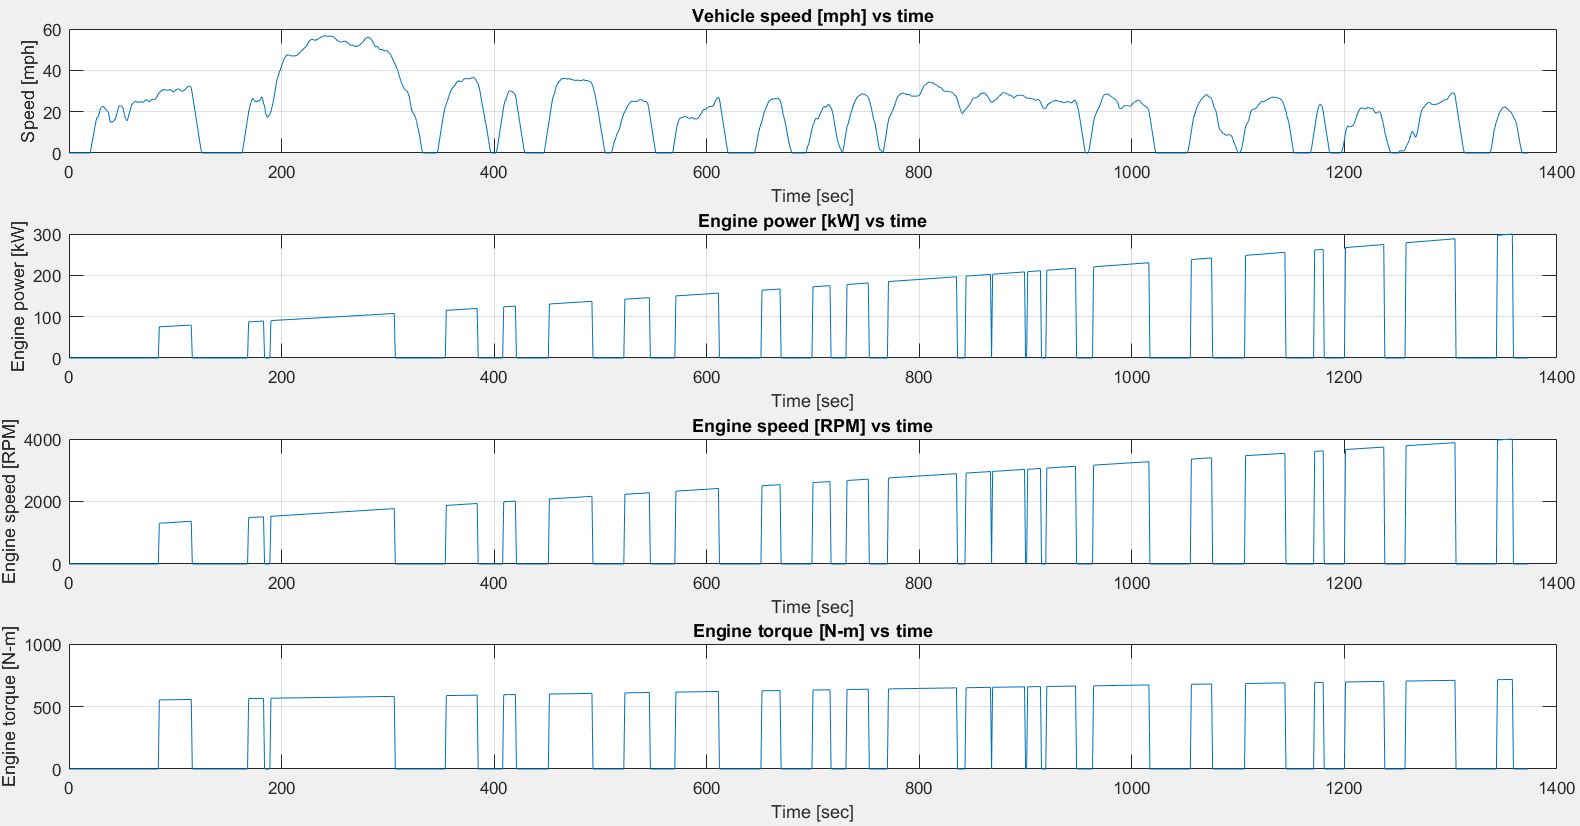
US06 DRIVING CYCLE:
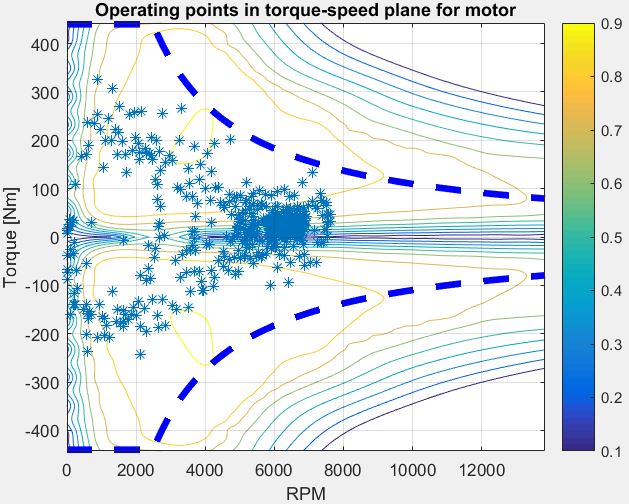
Operating motor points in US06 driving cycle
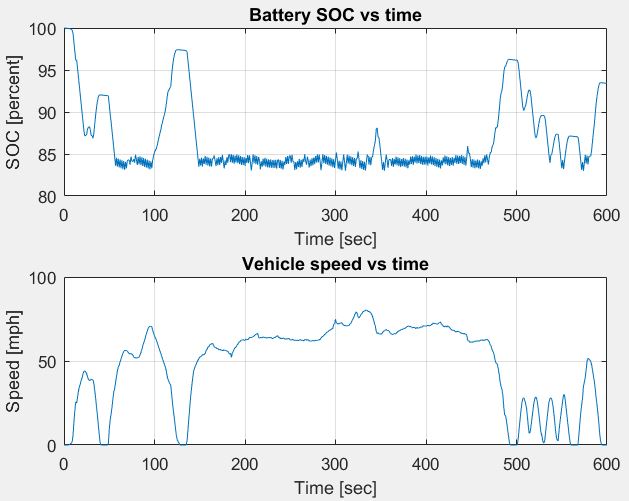
Sustaining SOC and variation of SOC in US06 driving cycle
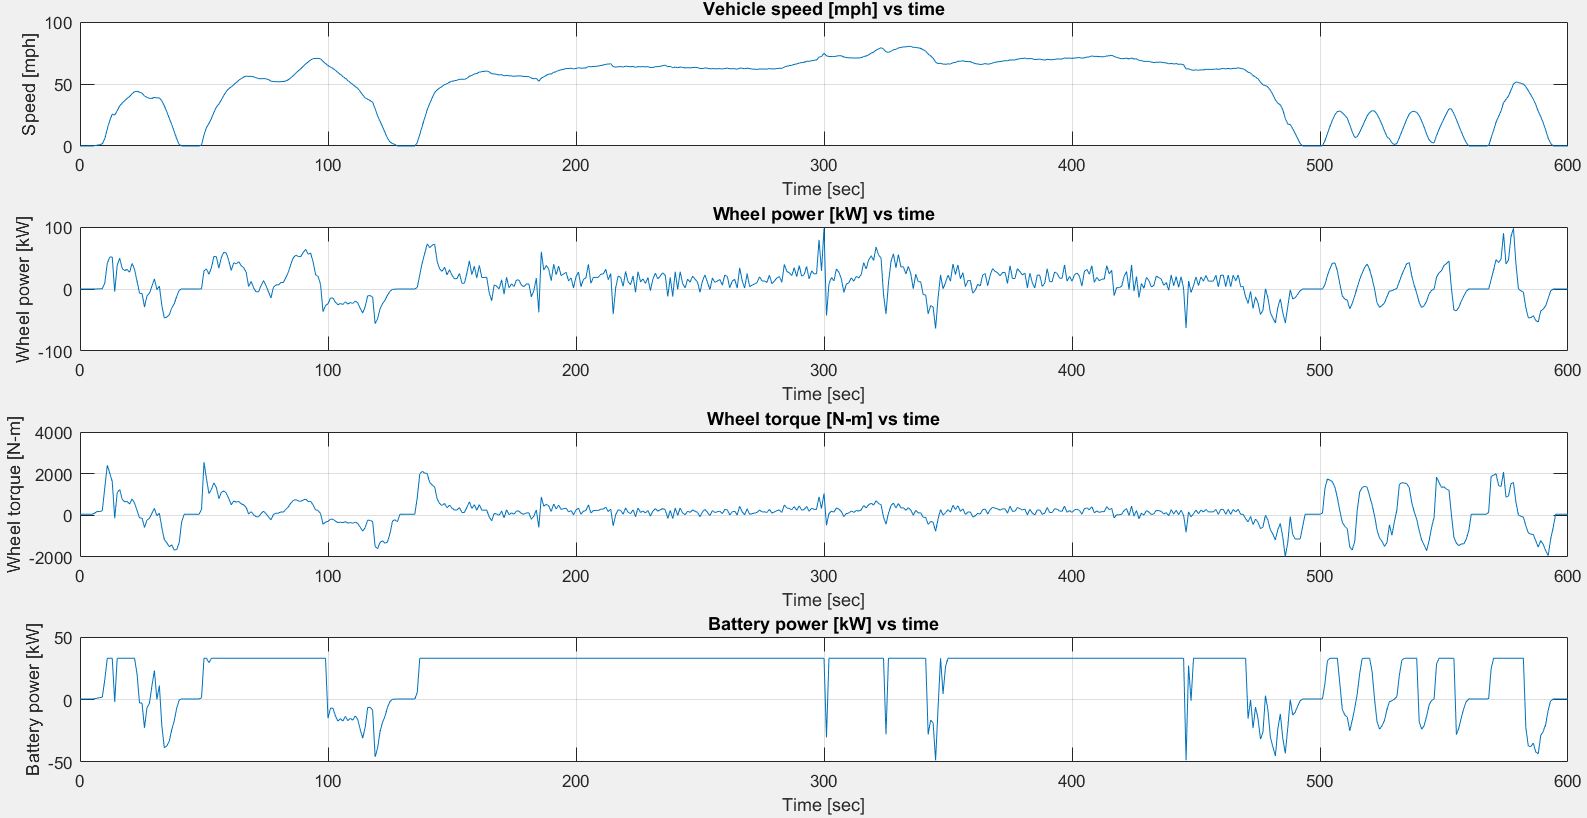
US06 driving cycle plots monitoring battery power
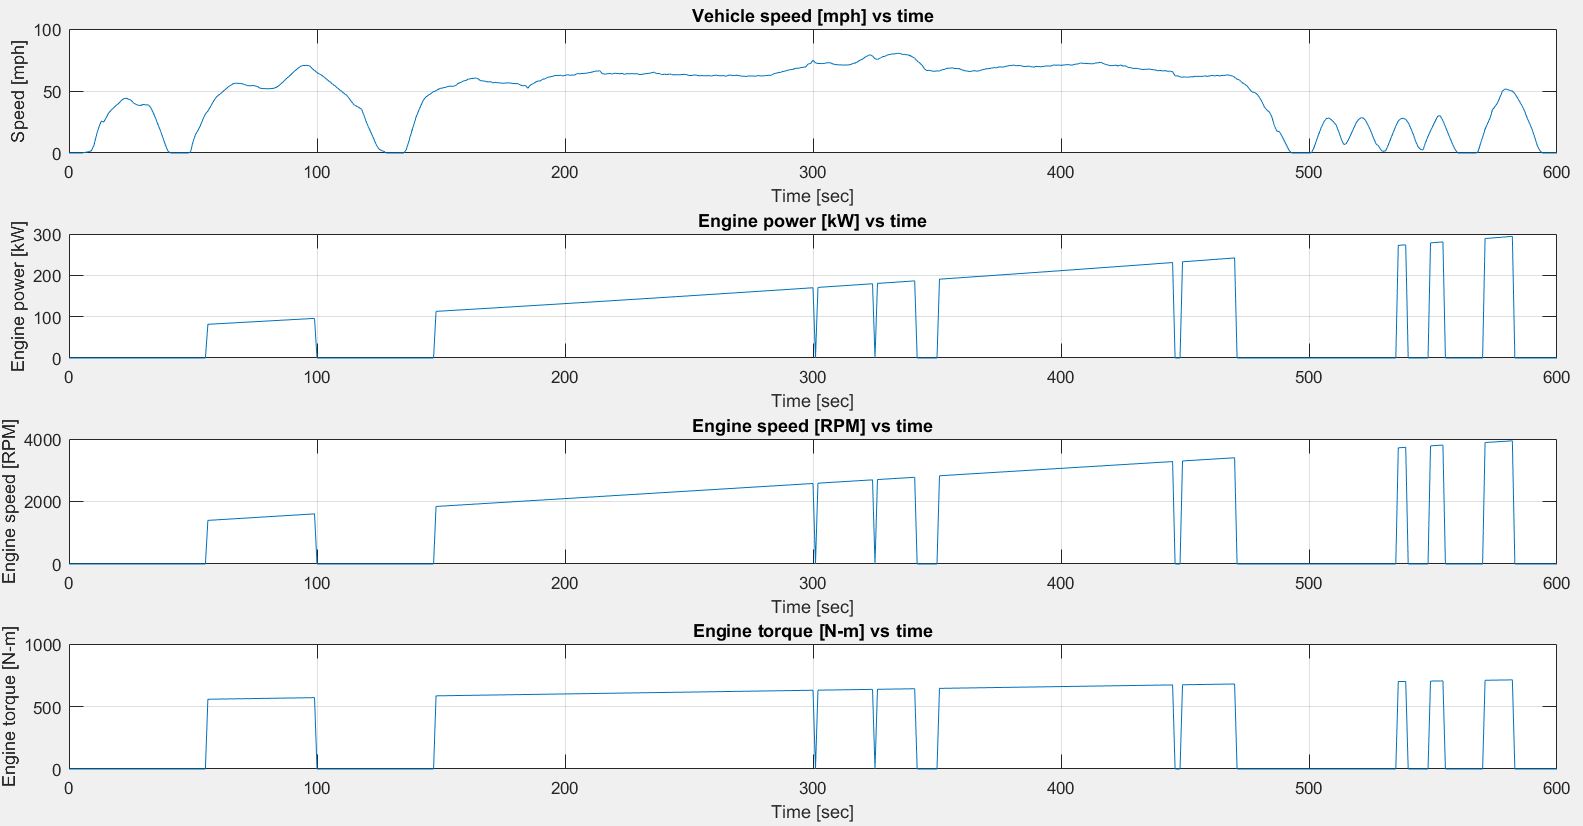
US06 driving cycle plots monitoring Engine parameters